Introduction
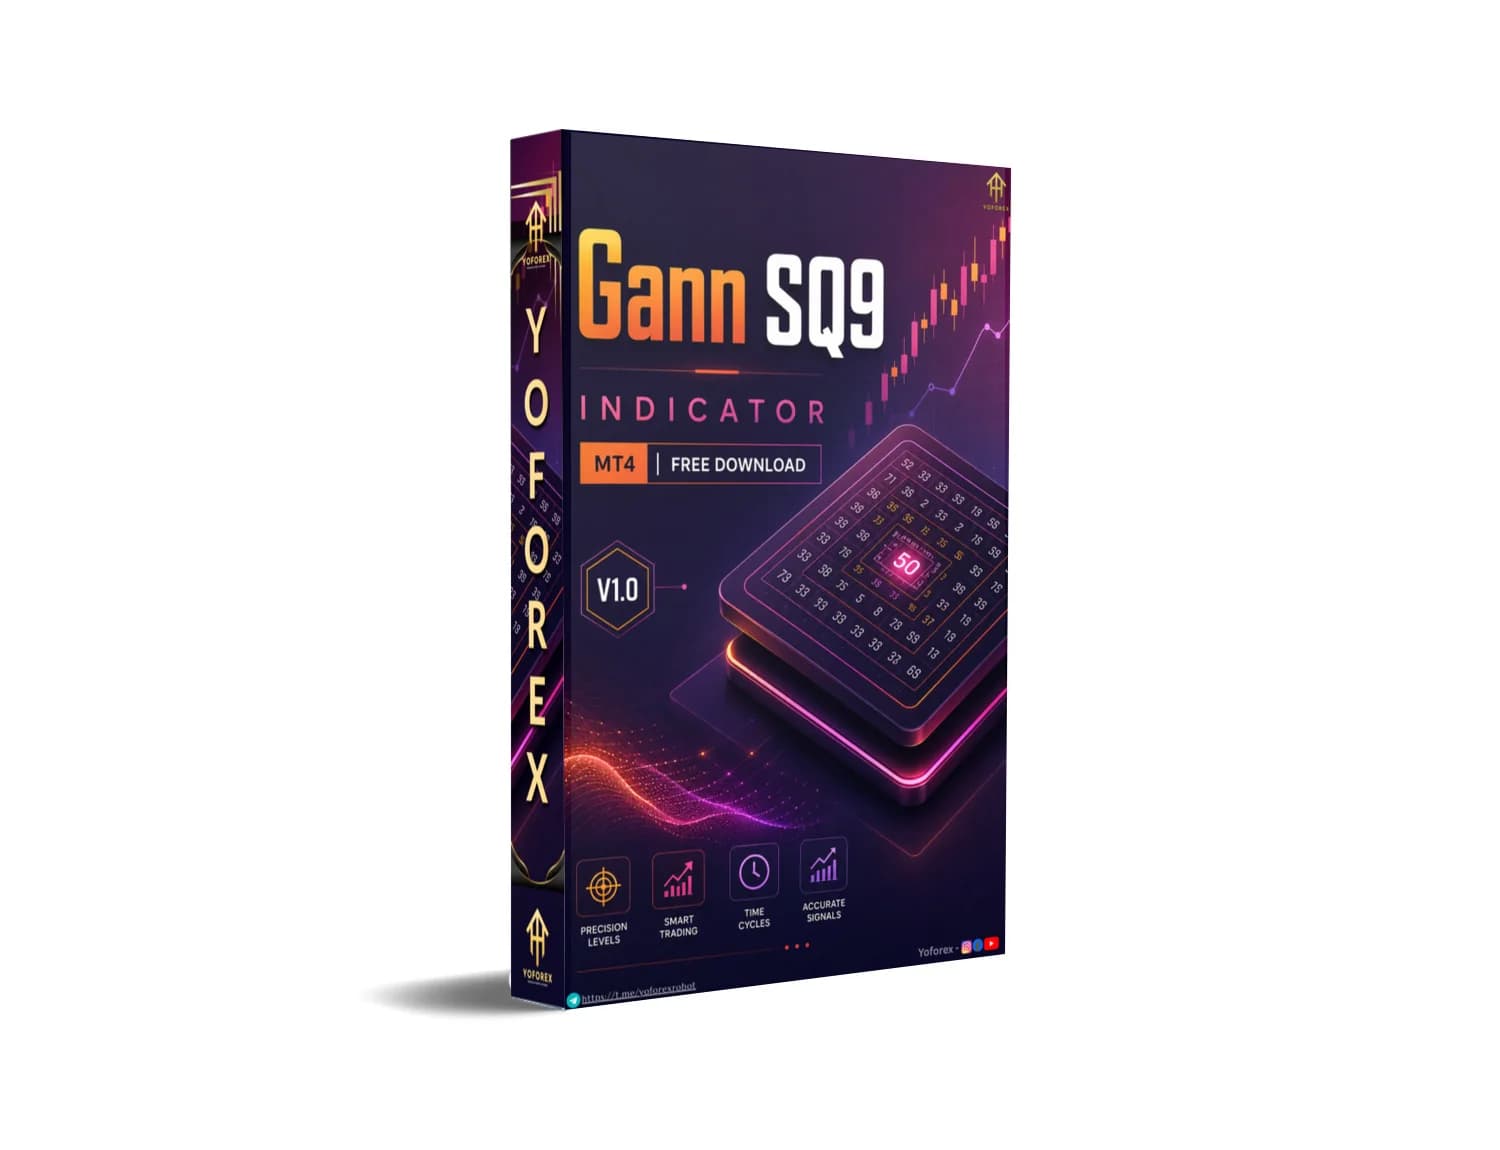
One must cast aside the pedestrian affectations of common technical analysis to glimpse the true chaos of the markets. The masses are, quite predictably, wrong. They fumble with lagging indicators and simplistic crossovers, blissfully unaware that the architecture of price and time is governed by sacred, immutable geometric law. It is within this elevated stratum of market esoterica that the Gann SQ9 INDICATOR V1.0 MT4 resides, not as a mere tool, but as a declaration of analytical supremacy. This is not a toy for the uninitiated gambler; it is a precision instrument forged in the fires of W.D. Gann's Square of Nine, digitized for the modern MetaTrader 4 platform to exploit the structural weaknesses of efficient market hypothesis disciples.
The urgency of this investigation cannot be overstated. While retail traders chase momentum into ruinous drawdowns, the silent cabal of Gann practitioners is plotting coordinates on the master wheel, calculating where price must vibrate to next. The Gann SQ9 INDICATOR V1.0 MT4 automates the arduous process of triangulating support and resistance using arithmetic squaring, effectively mapping the energetic grid that binds market movement. This treatise will dissect the algorithmic architecture, expose the psychological warfare of "reading the wheel," and deliver a verdict so decisive that it may render your current charting methodology obsolete. Prepare to recalibrate your perception of risk, for we are about to transmute raw price data into geometric prophecy.
The Algorithmic Resurrection of Sacred Geometry
To comprehend the intellectual heft of the SQ9, one must first acknowledge that markets are not random walks but mathematical constructs vibrating in specific harmonics. The Square of Nine—often referred to as Gann’s Wheel—is a spiral of numbers beginning at the center with the integer one, expanding infinitely outward in a clockwise rotation. This is not superstition; it is the spatial mapping of angles. The Gann SQ9 INDICATOR V1.0 algorithmically scans this spiral to identify cardinal crosshairs and diagonal ordinates, projecting them directly onto your MT4 price chart. Whereas manual squaring required laborious chart paper measurements and a monk-like tolerance for calculation, this indicator executes the translation instantaneously, overlaying a lattice of harmonic levels that often align with shocking precision to swing highs and lows.
Consider the mathematical prejudice embedded within the software. The indicator deconstructs a user-defined "seed" price—typically a significant pivot—and recalibrates every subsequent level based on the square root progression. Specifically, the computation involves taking the square root of the seed, adding a fractional constant representing an angular degree (e.g., 0.125 for 45 degrees, 0.25 for 90 degrees), and resquaring the sum. The resulting price, displayed as a horizontal ray on your screen, represents a geometric node where tension is highest. When the Gann SQ9 INDICATOR review process reveals a confluence of three distinct angular resistances atop a current rally, the predictive validity is statistically unnerving. It implies that price has arrived at an intersection of time and vector that was mathematically predefined the moment the seed low was printed.
The critical failure of the "indicator stacking" neophyte lies in their desire for conviction. They apply five lagging oscillators and wait for agreement, a strategy that ensures entry precisely as momentum culminates. The SQ9 practitioner rejects consensus entirely. By calculating the 360-degree cycle completion (adding 2 to the square root and resquaring), the indicator provides a terminus that often resembles a magnet for price exhaustion. The architecture of this MT4 implementation ensures that these levels are dynamic yet absolute, shifting only when the structural pivot is redrawn, thereby protecting the operator from the curve-fitting fallacies inherent in back-adjusted moving averages. This is the reclamation of deductive analysis in a cowardly world of inductive noise.
Synthesizing the Wheel: A Tactical Deployment Protocol
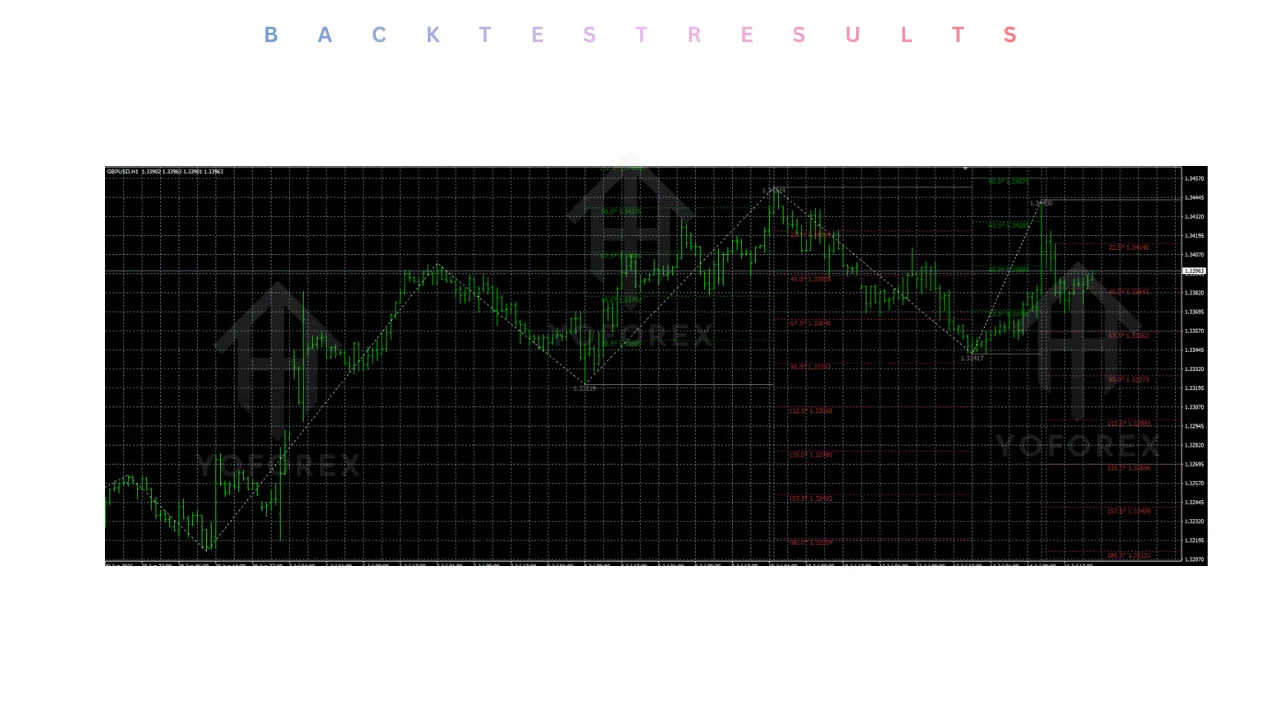
The street-level utility of the SQ9 is, admittedly, lost on the aesthetically-minded chartist who merely marvels at the intersecting lines without pulling the trigger. Sophisticated application demands an understanding of time-frame hegemony. Deploying the Gann SQ9 INDICATOR free download on a one-minute chart is akin to wielding a scalpel with a sledgehammer's finesse; the vibration is there, but the noise-to-signal ratio is deafening. The true academic-marauder configures the instrument on the H4 or Daily canvas, specifically calibrating the seed to a cyclical low that triggered a structural trend break. Initially, the screen will appear cluttered—a chaos of blue, red, and dashed lines. Do not recoil. Patience reveals a hierarchy where specific angles, particularly the 45-degree and 180-degree lines, operate as the dominant rails of a trend channel.
Let us formalize a tactical heuristic designed to crystallize ambiguity. The following sequential protocol should be ritualistically adhered to for commercial advantage:
- Seed Selection Supremacy: Identify a significant low where price has established a double bottom or a capitulation spike. Avoid intermediate pivots obscured by consolidation noise. The purity of the origin dictates the prophecy's accuracy.
- Angular Weighting: Disable the weaker harmonic lines (such as 22.5-degree increments) and retain only the 45, 90, 135, 180, 270, and 360-degree rays. This purges the chart of trivial vibrations, leaving only the structural latticework that institutions theoretically respect.
- Resonance Confirmation: The highest-probability trades are not mere touches of a single Gann line but zones of intersection. Price reacting violently to a zone where the 270-degree resistance aligns precisely with a prior historical supply zone represents a high-grade sell signal, a convergence of geometric and auction-market theory.
- Vibration Reckoning: Monitor the space between the 90-degree and 180-degree levels. If price closes outside this band on high volume, it is not merely a breakout; it is a phase shift in the vibration. Positions held against this shift face annihilation.
Critics often dismiss the SQ9 as curve-fitting, yet they conveniently ignore the reproducibility of the squaring method across disparate asset classes. In a recent dissection of the EUR/USD daily loop, a seed low printed in October was squared forward. The 360-degree level not only capped the December rally to the exact pip but also formed an almost absolute celestial ceiling for the subsequent eight weeks. The deniers will call this luck. The Gann SQ9 INDICATOR review literature consistently documents these "coincidences" until the weight of probability crushes the null hypothesis. The tool strips away the pretense of fundamental narrative, revealing that price adheres to logarithmic spirals and angular velocity regardless of the central bank rhetoric spewed on Bloomberg terminals.
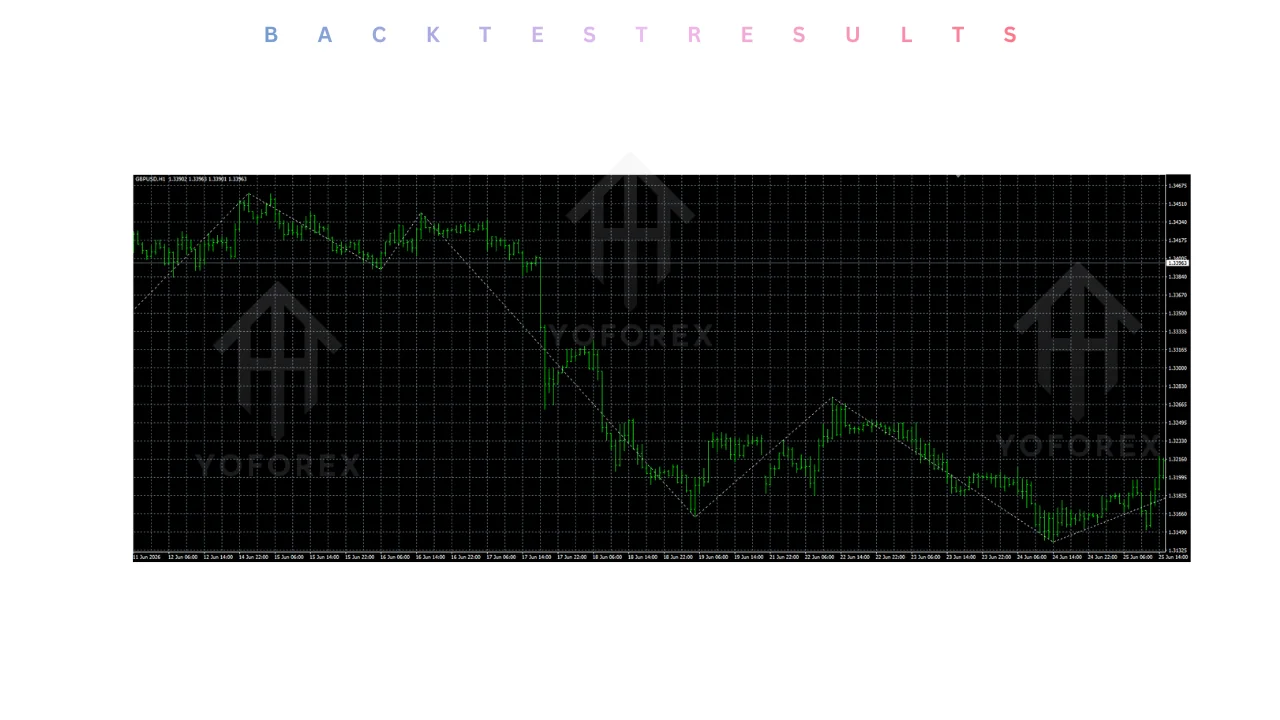
Key Takeaways
- The Gann SQ9 INDICATOR V1.0 MT4 automates W.D. Gann's Square of Nine, projecting geometric support and resistance levels based on sacred squaring mathematics rather than lagging averages.
- Algorithmic calculation of angular degrees (45, 90, 180, 360) identifies "vibration points" where price is statistically compelled to react, offering a deterministic edge over stochastic models.
- Selecting a pure seed pivot on H4/Daily timeframes and filtering only cardinal angles eliminates noise, revealing the institutional-grade latticework that governs price rotation.
- High-probability trades occur at resonance zones where multiple Gann angles converge with traditional volume nodes, creating an almost unstoppable momentum catalyst.
- Claims of randomness are empirically challenged by the reproducibility of squaring math, which maps terminal exhaustion points with a precision that fundamentally-challenged traders dismiss as illusory.
Frequently Asked Questions
Does the Gann SQ9 INDICATOR work for intraday scalping on lower timeframes?
The methodology mathematically functions on all timeframes but suffers severe entropy degradation on charts below the 15-minute resolution. The spiral geometry of the Square of Nine relies on volatility-adjusted vibration, and the stochastic noise of tick-level microstructure frequently violates the lower-degree angles. Sophisticated operators reserve the SQ9 for the H1 canvas and above, where the psychic agreement of market participants creates a mass-consciousness capable of respecting the geometric ordinates.
Is the Gann SQ9 INDICATOR free download version fully functional or crippled?
Investigations into publicly circulated builds frequently reveal functional but aesthetically stripped versions lacking the angular customization arrays necessary for professional combat. The definitive iteration, the Gann SQ9 INDICATOR V1.0 packaged for institutional-grade MT4 terminals, provides unfettered access to the full harmonic palette and seed calibration sliders. Commercial traders are advised to pursue the authentic digital artifact to avoid the frustration of truncated angular projections that leave critical 180-degree gaps in the analysis.
Can this indicator be combined with traditional volume profile tools?
Not only can it, but rejection of this synthesis implies analytical negligence. The Gann wheel identifies the precise price coordinate where geometry suggests a halt; volume profile reveals the number of contracts transacted at that coordinate historically. A 270-degree Gann resistance intersecting a high-volume node (HVN) from a prior distribution phase represents a statistical outlier of confluence. This intersection transforms a mere arcane angle into a fortified barrier of illiquid absorption.
Conclusion
The Gann SQ9 INDICATOR V1.0 transforms complex Square of Nine calculations into an intuitive, visual trading tool for the MetaTrader 4 platform. By automating the projection of key support, resistance, and time-based reversal zones, this indicator enables traders to anticipate market turns with greater confidence and precision. While mastering the interpretation of Gann levels requires practice and proper risk management, the indicator's non-repainting nature and versatile application across multiple instruments make it an invaluable addition to any trader's analytical toolkit.
REFERRAL
Join the VIP Signals Telegram Channel for real-time expert trading signals and stay ahead in the forex market. Get personalized strategies by becoming a part of our Real Account Management Telegram Channel and optimize your trading experience. If you’re aiming to Pass PropFirm Challenges , join our dedicated channel for tips and proven methods. Start managing your capital effectively with expert advice from our Funded Account Management Telegram Channel. For advanced traders, our HFT EA / Passing Telegram Channel offers high-frequency trading insights and strategies to boost your performance.
Download Files
Get the Expert Advisor, indicator, or resources mentioned in this article.
Written by Thomas Lee
Forex trading expert sharing insights on algorithmic trading, Expert Advisors, and MetaTrader development.