
Overview
The Average Daily Range (ADR) Indicator for MetaTrader 4 measures typical daily price movement by averaging the distance between each session’s high and low over a user-defined period. Intraday traders rely on ADR to:
- Identify potential support and resistance zones
- Gauge volatility shifts before entries/exits
- Fine-tune stop-loss and take-profit levels
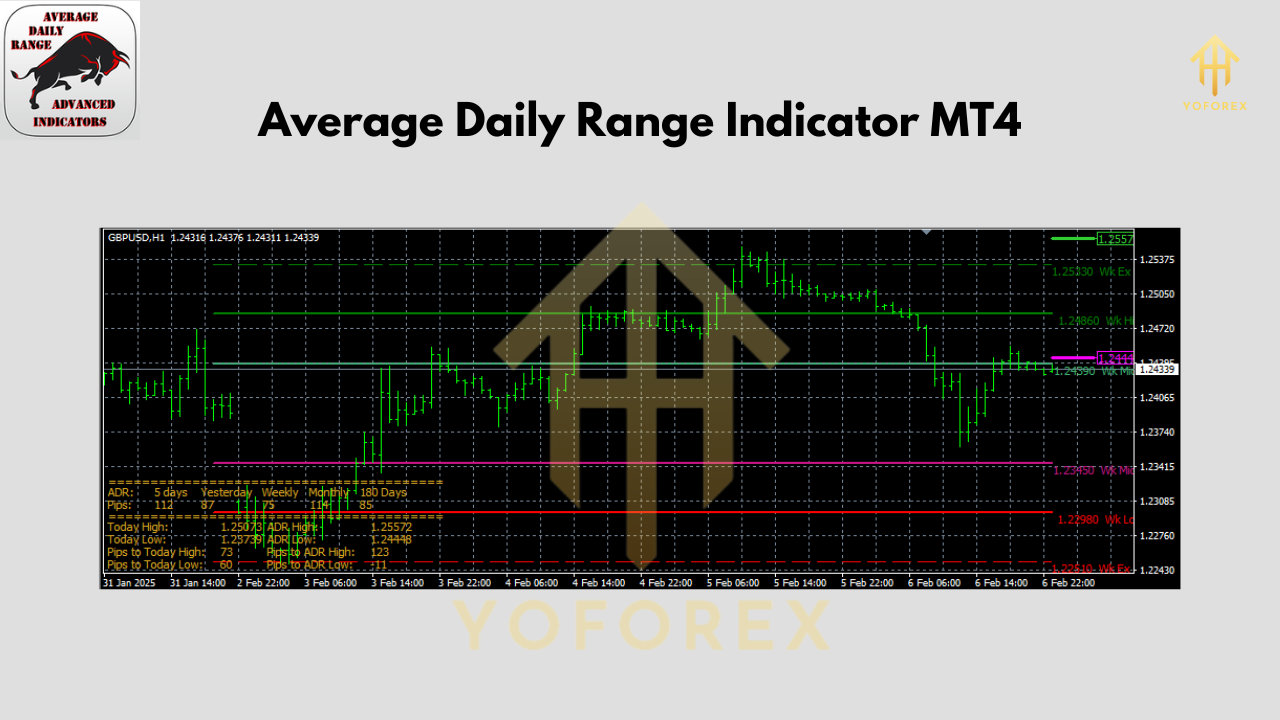
By plotting two horizontal lines—ADR High and ADR Low—the indicator frames the “expected” daily range, helping you quickly spot overextended moves or fading momentum.
 Key Features
- Custom Look-back Period: Choose how many days to average (e.g., 5, 10, 20)
- Dynamic Range Bands: ADR High and ADR Low auto-update each new bar
- Timeframe Agnostic: Works on M1 through Monthly charts
- Visual Customization: Adjustable line colors, styles and thickness
- Alerts: Optional pop-up or email when price touches ADR boundaries
- Lightweight: Minimal CPU impact, perfect for multiple charts
How ADR Works
- High–Low Calculation: For each day, the indicator computes (High – Low).
- Averaging: It then averages those daily ranges over your chosen look-back period.
- Plotting Bands: Finally, it draws two parallel lines above and below the previous day’s close:
- ADR High = Previous Close + (Average Range ÷ 2)
- ADR Low = Previous Close – (Average Range ÷ 2)
These bands represent where price typically ends up by day’s end; when price extends beyond them, it often signals exhaustion or breakout potential.
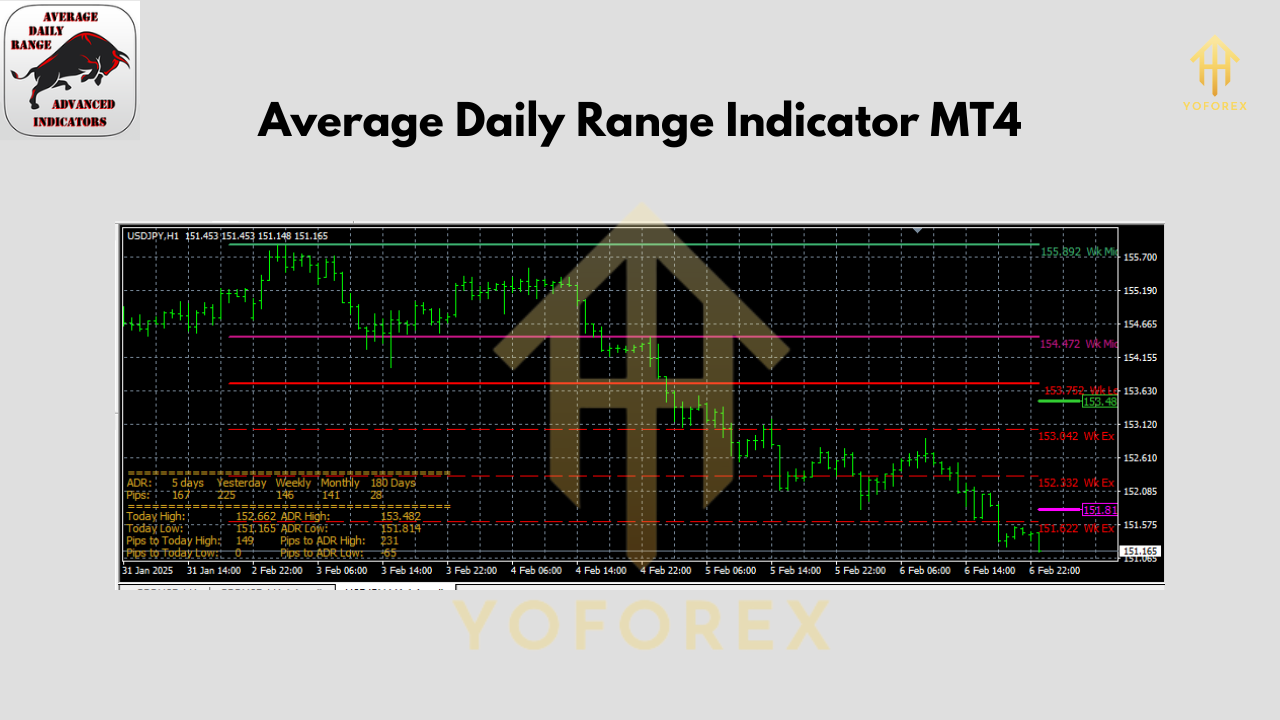 Using ADR in an Uptrend
On a strong uptrend, price will often ride the ADR High band. If price tests but fails to convincingly break above ADR High, expect a pullback to value area (mid-range). Look for bullish candlestick patterns—like pin bars or inside bars—near ADR Low for low-risk entries, placing your stop just below the band.
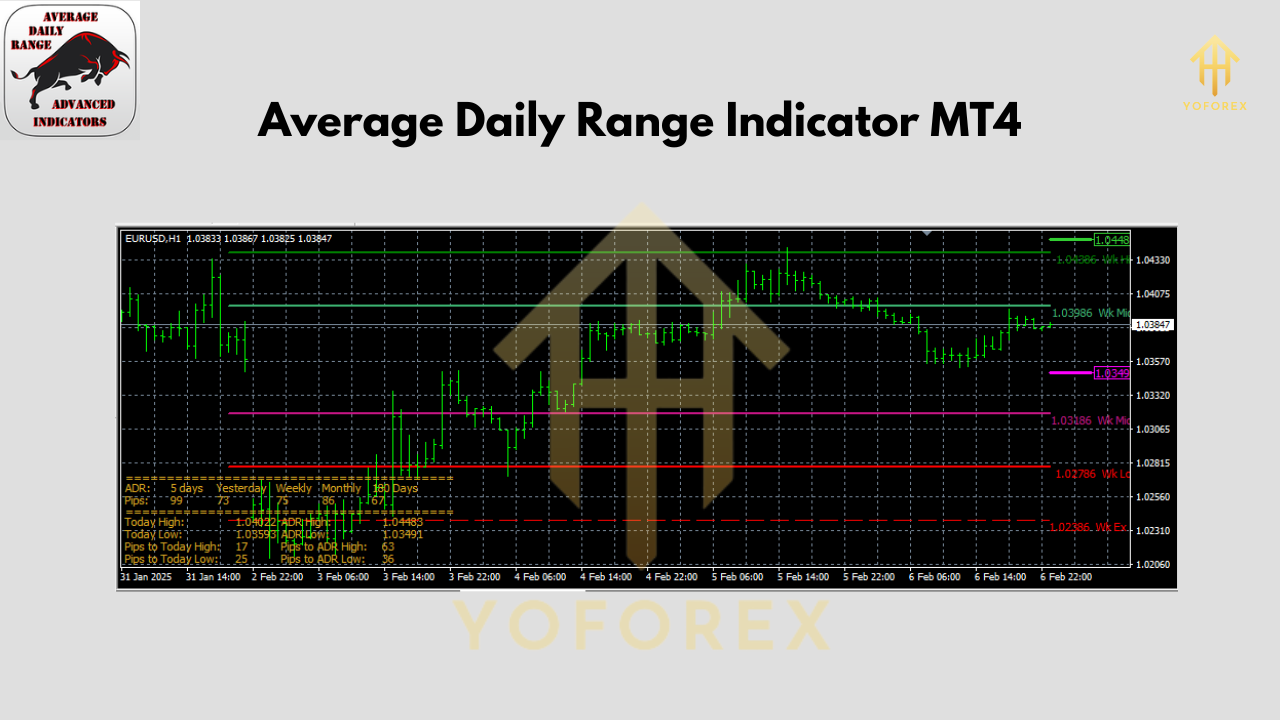
Using ADR in a Downtrend
Conversely, in a downtrend scenario price frequently retraces up toward the ADR High band. Watch for reversal patterns (e.g., bearish engulfing) at that level. A short entry with a stop just above ADR High offers a favorable risk/reward, as the band often acts like dynamic resistance.
Installation & Setup
- Download the ADR Indicator from ForexFactory.cc (link below).
- Copy
ADR.ex4intoMQL4/Indicatorswithin your MT4 data folder. - Restart MetaTrader 4 (or Refresh Navigator).
- Drag & Drop “ADR” onto your chart.
- Adjust Inputs:
- ATR Period: Default 14 (changes look-back)
- Line Color/Style/Width: Tweak for clarity
- Alert Settings: Enable pop-up or email notifications
 ADR Indicator Settings
- ATR Period: Number of days to average (higher = smoother bands)
- Line Design: Solid, dashed, dotted
- Line Thickness: 1–3 px
- High/Low Colors: Pick contrasting hues for easy reading
- Alert Mode: Off / Popup / Email
Conclusion
The Average Daily Range (ADR) Indicator is a must-have for anyone trading intraday. It clarifies where price “should” move each session, helping you avoid chasing overextended moves and pinpoint dynamic support/resistance. Combine ADR with momentum or volume tools for even sharper trade setups.
Join our Telegram for the latest updates and support


Comments
No comments yet. Be the first to comment!
Leave a Comment