
Elliott (Eliot) Wave Indicators MT4: A Practical Guide for Real-World Trading
If you’ve ever stared at a chart thinking, “there has to be a pattern in here somewhere…”, you’re not alone. Elliott Wave (yeah, some folks write it “Eliot Wave”) is one of those timeless frameworks traders use to make sense of market swings—impulses, pullbacks, and those larger cycles that keep repeating because trader psychology keeps repeating. On MetaTrader 4 (MT4), you’ll find a handful of built-in tools and third-party Elliott Wave indicators that make spotting these structures way easier. In this guide, I’ll walk you through what matters, how to set things up on MT4, and a simple, repeatable plan to trade waves without getting lost in over-labeling. No fluff—just what actually helps you take cleaner trades.
What Elliott Waves Are (and Why You Should Care)
At its core, Elliott Wave theory says markets move in impulse phases (with the trend) and corrective phases (against it). A classic impulse is five waves (1-2-3-4-5), and a correction is three waves (A-B-C). You’ll see this fractal pattern on multiple timeframes: the same structure popping up inside bigger structures. The goal isn’t to label every little wiggle; it’s to identify where you are in the bigger picture so you can trade in sync with momentum and avoid chasing dead ends.
Key takeaways:
- Impulses tend to travel further and faster than corrections.
- Corrections are messy; impulses are cleaner—so focus your risk where structure is clearer.
- Fibonacci levels and channels help anchor wave projections when your eyes start second-guessing.
The MT4 Toolkit for Elliott Wave
You can trade Elliott Wave on MT4 with a mix of built-in tools and optional add-ons. Out of the box, MT4 already gives you enough to start:
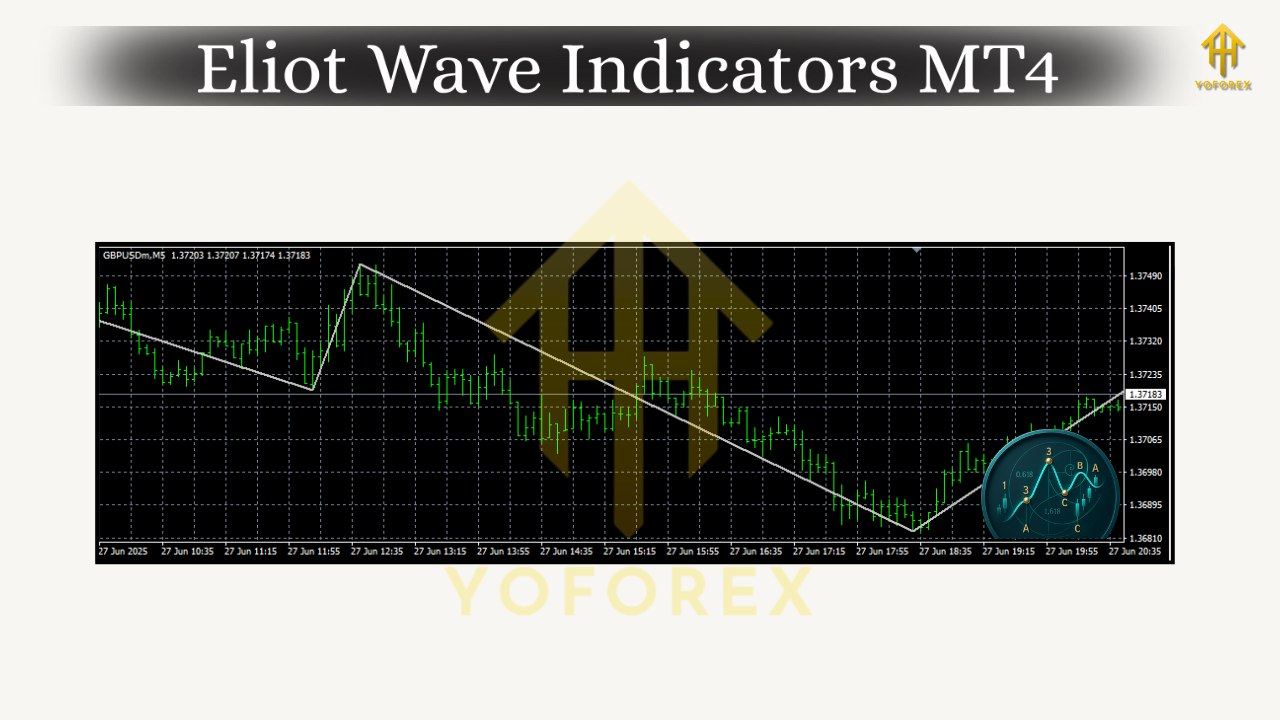
- ZigZag: Not a wave counter, but an excellent swing filter; it helps you visualize swing highs/lows so you can map impulses vs. corrections.
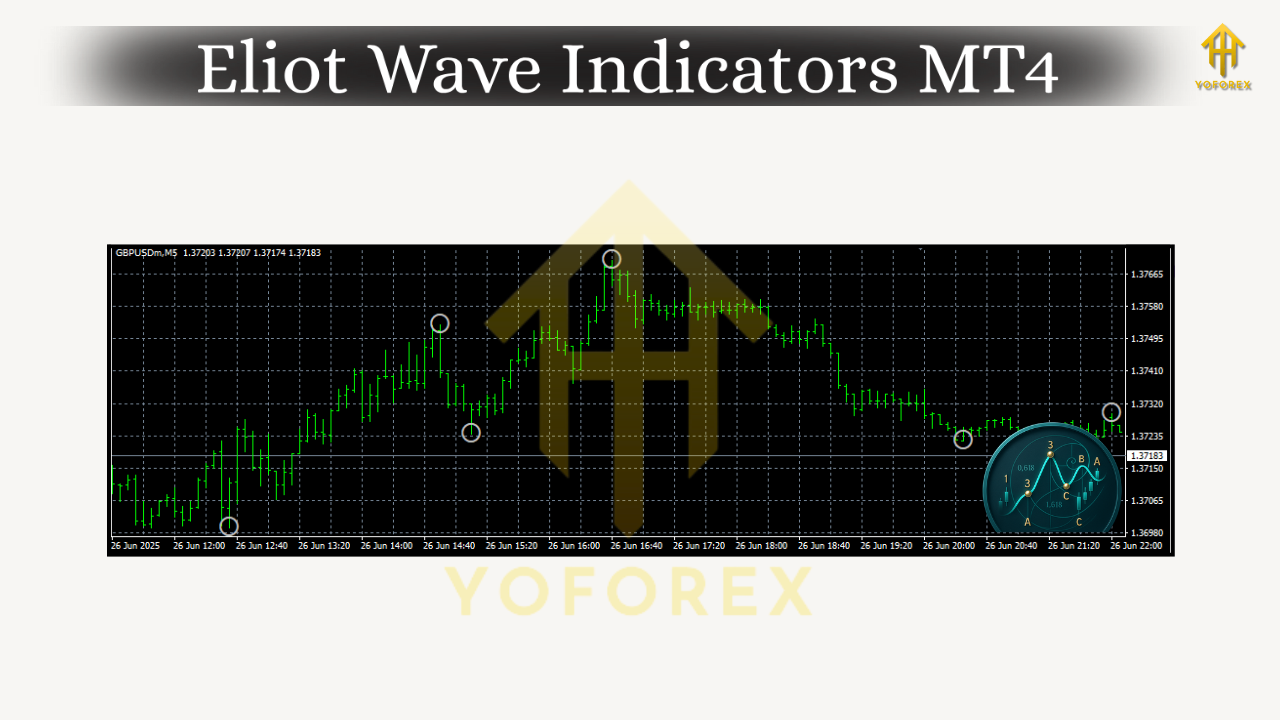
- Fractals: Marks local turning points; useful for drawing channels or validating breakouts after a wave 4 consolidation.
- Fibonacci Retracement/Extension: Bread and butter for measuring wave 2/4 pullbacks and projecting wave 3/5 targets.
- Trendlines & Channels: Draw a base trendline under waves 2–4 (or over 2–4 in a downtrend) to manage risk and spot late-stage impulses.
- Elliott Wave Oscillator (EWO) (third-party or custom): Typically a 5/34 moving average histogram; helps differentiate strong wave 3s from weaker legs.
- Elliott Wave Auto-Labelers (third-party): Can be handy, but don’t rely on them blindly—use as a second opinion, not gospel.
Pro tip: Whether you spell it Elliott Wave or Eliot Wave, MT4 indicators you’ll find online sometimes use both terms. Search for both if you’re hunting for a specific tool.
A Simple Elliott Wave Trading Plan (That Doesn’t Fry Your Brain)
Let’s keep this practical. Here’s a lightweight workflow that blends ZigZag, Fibonacci, and a momentum read (EWO or your favorite MACD/RSI alternative):
- Top-down scan.
Start on H4 or H1 to identify the dominant trend. Are you in a strong push (likely wave 3) or a choppy correction (likely A-B-C)? Mark key swing points with ZigZag. - Map the impulse.
If you spot a clean five-wave push (or at least a strong 1-2-3 skeleton), draw a channel. In an uptrend, connect wave 2 and 4 lows; parallel it over wave 3 high. That channel frames your trade idea. - Use Fibonacci to size the pullback.
- Wave 2 often retraces 50–61.8% of wave 1.
- Wave 4 often retraces 23.6–38.2% of wave 3 and tends to be shallower/sideways.
If a pullback runs beyond 61.8% without momentum divergence, be cautious—your count might be off.
4. Confirm with momentum (EWO).
Wave 3 typically shows the strongest histogram expansion. For a wave 5 attempt, look for price making a new high while the oscillator prints a lower high (bearish divergence)—that hints you’re late.
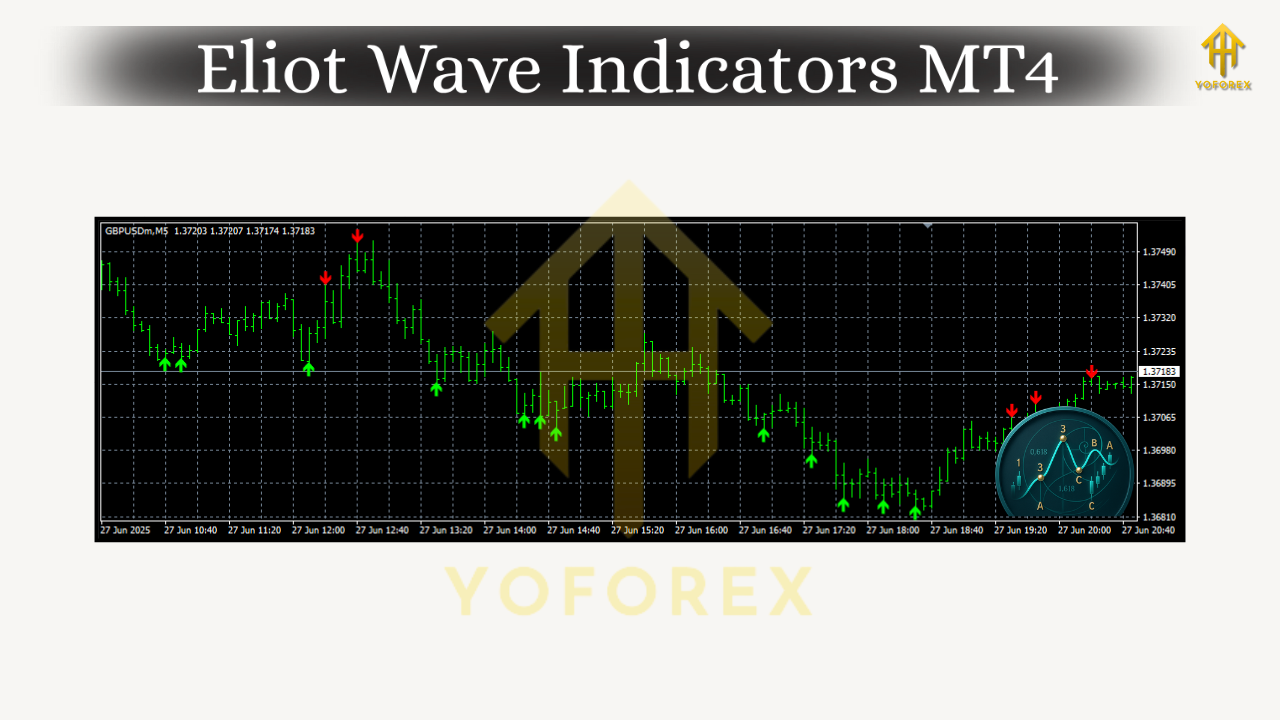
5. Entry triggers.
- Wave 3 continuation: Buy the pullback of wave 2 around 50–61.8% with structure support; stop below the swing low.
- Wave 5 attempt: Only if the structure is clean and momentum isn’t dying—use a tighter stop and be nimble.
- Corrections (A-B-C): If you’re counter-trend trading C-waves, keep risk small; they can fail fast.
6. Targets.
- Wave 3 often reaches 1.618× wave 1.
- Wave 5 can match wave 1 or reach 0.618× of 0–3 (Fibo extension).
Trail beneath the channel or last fractal to protect gains.
7. Invalidation.
If price violates your channel base or breaks the swing low you’re anchored to, cut it. Don’t negotiate with invalidation—coz that’s how small red turns big red.
Popular Elliott Wave Indicators for MT4 (What They Actually Do)
- ZigZag-assisted Wave Maps: These scripts don’t “know” Elliott Wave, but they clean up noise so your manual counting is easier.
- Automatic EW Counters: Convenient for a first pass, but re-label often. Use them to spot candidate structures, then validate manually.
- Elliott Wave Oscillator (EWO): A quick read on which leg is “the engine.” In healthy wave 3s, EWO swells; in late wave 5s, EWO often diverges.
- Fibo Projection Helpers: Some add-ons let you drop standardized retracement/extension grids with one drag—saves time, reduces errors.
- Structure/Divergence Packs: RSI/CCI divergence markers and swing structure tools complement wave reading beautifully, especially for wave 5 tops and C-wave ends.
How to Install Elliott Wave Indicators on MT4
It’s straightforward—just don’t skip the restart:
- Download the indicator file (
.mq4or.ex4). - In MT4, go to File → Open Data Folder → MQL4 → Indicators and paste the file there.
- Restart MT4 (or right-click Indicators in Navigator and hit Refresh).
- Drag the indicator from Navigator → Indicators onto your chart.
- Inputs: Set your ZigZag depth/deviation for your timeframe (e.g., higher values on H1/H4), adjust EWO periods (common: 5/34), and set Fibonacci levels you actually use (38.2, 50, 61.8, 100, 161.8, 261.8).
Quick sanity check: If an auto-labeler throws a count that fights obvious trend, trust your eyes + channel + Fibo first. Tools assist; structure leads.
Timeframes, Pairs, and When Not to Trade
- Timeframes: H4/H1 for context, M15/M5 for timing. Ultra-low TFs can over-label; try to keep averages under control.
- Pairs: Major FX pairs (EURUSD, GBPUSD, USDJPY) are wave-friendly; gold (XAUUSD) moves beautifully but is more volatile—use tighter invalidation.
- When to stand down: Before big news (CPI, NFP, central bank decisions). Corrections morph, spreads widen, and wave counts get squirrelly.
Risk Management (The Non-Negotiables)
- Position sizing: risk 0.5–1.5% per setup until you’ve logged 50+ trades with positive expectancy.
- Hard stops belong beyond the swing that invalidates your thesis (and inside your channel logic).
- Trail as price respects the channel. If structure breaks, you’re out—no “just in case” hold.
A Clean Example You Can Replicate
Imagine EURUSD on H1: You spot a push up (wave 1), a neat pullback to 50–61.8% (wave 2), and momentum surging (EWO expands) as price breaks above wave 1 high—hello wave 3. You ride it inside your channel, scale partials at 1.618× wave 1, then watch consolidation (wave 4) retrace around 23.6–38.2% of wave 3. Final pop (wave 5) shows momentum divergence on EWO—tag your take-profit or trail tighter. That’s the rhythm. Rinse, repeat, and don’t force it when the chart is mushy.
Common Mistakes (And How to Dodge Them)
- Over-labeling every micropivot. Keep your count minimal; if you need a legend to understand your own chart, it’s too busy.
- Ignoring invalidation. The market doesn’t care how “nice” your count looks—price > pattern.
- Expecting perfect symmetry. Real markets rhyme; they don’t photocopy.
- Trading every wave. Your edge is in the clean ones—especially wave 3 and the early part of wave 5 (with caution).
Final Thoughts
Elliott Wave on MT4 works best when you keep it simple: identify the dominant trend, measure your pullbacks with Fibonacci, validate with a momentum read, and manage risk using channels and clear invalidation. Whether you call them Elliott Wave Indicators or Eliot Wave Indicators on MT4, the point is the same—use tools to reduce subjectivity, not to replace your judgment. Build a small playbook, log your trades, and you’ll start seeing the same structures again and again… because human behavior keeps looping.


Comments
No comments yet. Be the first to comment!
Leave a Comment