
Introduction
Are you tired of guessing where major players accumulate orders? Liquidity Finder Indicator V1.2 MT5 (LF) is here to shine a light on those hidden liquidity pools. Built around ICT and Smart Money principles, LF draws dynamic and static trend lines to pinpoint where liquidity highs and lows are lurking. Whether you’re an intraday scalper or a swing trader on H4, this tool gives you clear visual cues on your MetaTrader 5 charts, so you can trade with confidence and precision.
In this post, we’ll dive into how LF works, its key benefits, practical use cases, and a quick guide to get it up and running on your MT5 platform. Let’s unlock those liquidity zones!
Overview
Liquidity Finder Indicator V1.2 MT5 is designed to reveal areas where institutional traders have likely placed their stop orders. It plots:
- Dynamic Trend Lines: Continuously updating lines that adapt to recent price swings, marking fresh liquidity pools.
- Static Trend Lines: Fixed lines showing classic double-top or double-bottom patterns where liquidity has clustered historically.
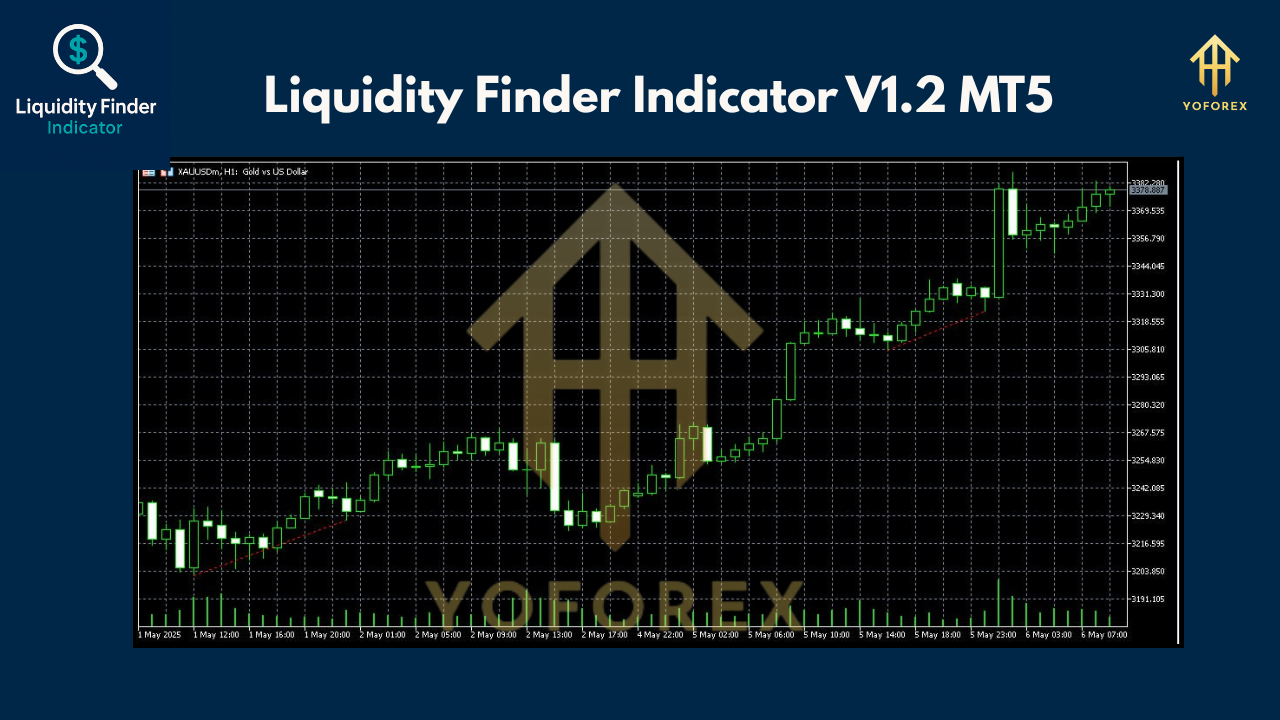
On your chart, blue lines mark liquidity highs, while red lines show liquidity lows. Whether price is consolidating or trending, LF highlights the zones where the market may reverse or surge as it chases stop orders.
Key Features
• 100% non-repaint lines for clear historical reference
• Dual mode—dynamic (real-time) and static (classic) trend lines
• Multi-timeframe support: M1–M5, M15–M30, H1–H4
• Compatible with all Forex, crypto, stocks, and indices symbols
• Intermediate-level tool with straightforward inputs
• Leading indicator type for breakout anticipation
• Adjustable lookback period and sensitivity settings
• Visual alerts when price touches liquidity zones
• Optimized for both scalping and day trading
• Works seamlessly with other Smart Money tools
How the Liquidity Finder Works
- Data Analysis: LF scans historical price action to detect swing highs and swing lows over your chosen lookback period.
- Static Line Placement: When a double-top or double-bottom is confirmed, the indicator locks in a static trend line at that level.
- Dynamic Updates: As new price swings form, the dynamic trend lines shift to reflect current liquidity zones.
- Color Coding: Blue trend lines denote liquidity highs (sell-stop clusters); red lines denote liquidity lows (buy-stop clusters).
- Trading Signals: When price approaches these lines, you’ll get visual cues—potentially an entry or exit zone depending on your strategy.
By combining both static and dynamic perspectives, LF ensures you never miss fresh liquidity zones while still honoring classical chart patterns.
Benefits & Proof
With Liquidity Finder V1.2 MT5, you gain:
- Improved Precision: Trade entries and exits based on where real money flows, not arbitrary Fibonacci retracements.
- Reduced Risk: Avoid trading blind into thin liquidity; anticipate reversals at key aggregation points.
- Versatility: Applies equally well to fast scalping on M1–M5 or swing trades on H1–H4.
- Clarity: Clear, color-coded lines make chart analysis intuitive, even under volatile conditions.
Example: On the XAUUSD H4 chart, LF marked a static liquidity high at 2306.93. After price dipped to gather liquidity at a new red line, it surged past 2335.69—exactly where LF signaled a buy-stop hunt, resulting in a 1.5% move within hours.
Practical Use Cases
- Breakout Confirmation: Watch for price consolidating under a blue line—once it breaks out, a rapid liquidity grab often follows.
- False-Break Reversals: When price dips below a red line but fails to hold, it signals weak sell-side pressure and a quick rebound.
- Trend Continuation: In a strong trend, dynamic lines update to guide you on where to add to your position safely.
- Multi-Pair Scanning: Run LF on several correlated pairs to spot concurrent liquidity hunts and hedge risk.
 Installation & Configuration
- Download: Get the LF .ex5 file from ForexFactory.cc’s indicator section.
- Copy: Place
LiquidityFinderV1.2.ex5into yourMQL5/Indicatorsfolder. - Restart MT5: Reload the Navigator panel (or restart your terminal).
- Attach to Chart: Drag “Liquidity Finder V1.2” onto the desired symbol and timeframe.
- Inputs:
- Lookback Period: default 50
- Static Mode Threshold: default 2 (for double-tops/double-bottoms)
- Alert On/Off: true
6. Save Template: Right-click chart → Template → Save Template, so you can apply LF with one click any time.
Tips & Best Practices
- Use on higher-liquidity pairs like EURUSD or XAUUSD for more reliable line placements.
- Combine with volume indicators to confirm liquidity hunts.
- Avoid trading directly at static lines; wait for a candlestick confirmation.
- Adjust lookback period based on volatility—shorter for fast markets, longer for slow markets.
Conclusion
Liquidity Finder Indicator V1.2 MT5 empowers you to trade where institutional orders lie, turning guesswork into strategy. By marking both fresh and historical liquidity zones, LF equips you with a dual-lens view of Smart Money movements. Install it today on MetaTrader 5 and start spotting those pivotal levels!
Join our Telegram for the latest updates and support


Comments
Bjr Admin, Quel est le mot de passe du winrar Liquidity Finder V1.2 Merci
Leave a Comment