
If you are exploring the MnF Forex Signals Indicator V1.0 for MetaTrader 4 (MT4), this guide is designed to help you get real, testable results without hype. Instead of relying on screenshots or one-off claims, you’ll learn a structured way to install the indicator, define entry/exit rules, measure performance, and manage risk so your results can be repeated and improved over time. This article is written for beginners who want a dependable process and for intermediate traders who need a checklist they can trust.
What the MnF Signals Indicator Tries to Do
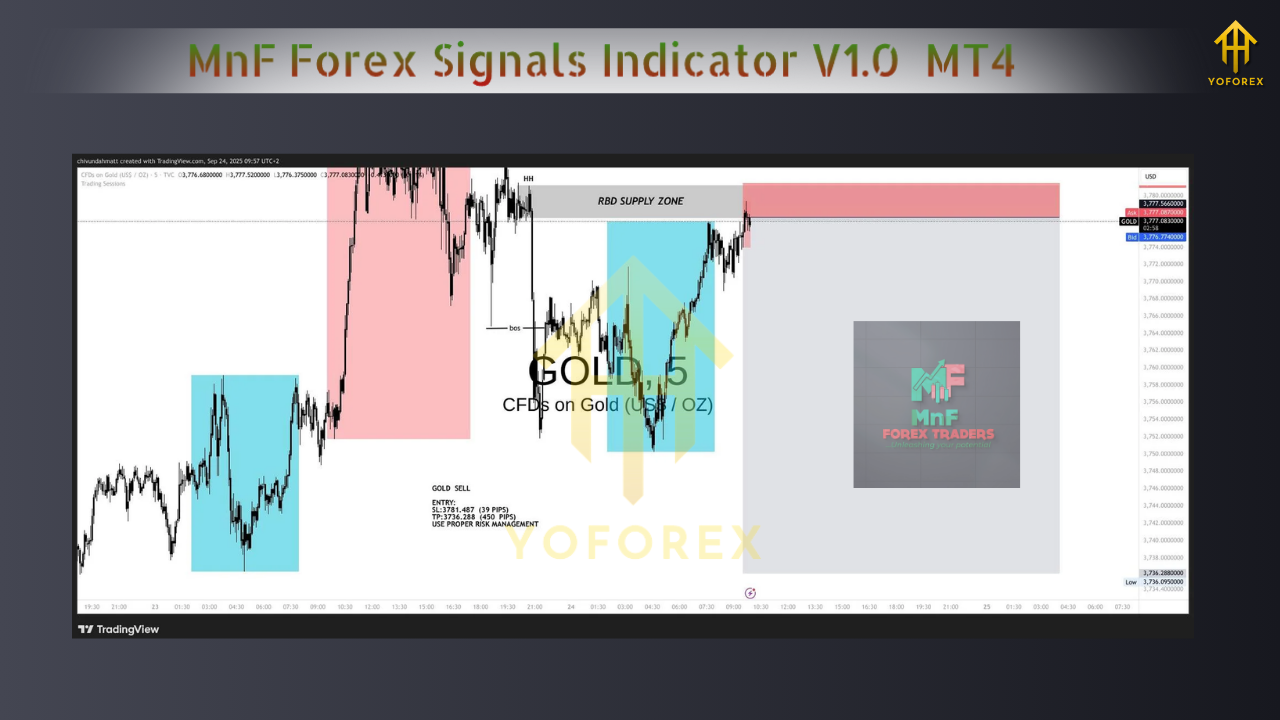
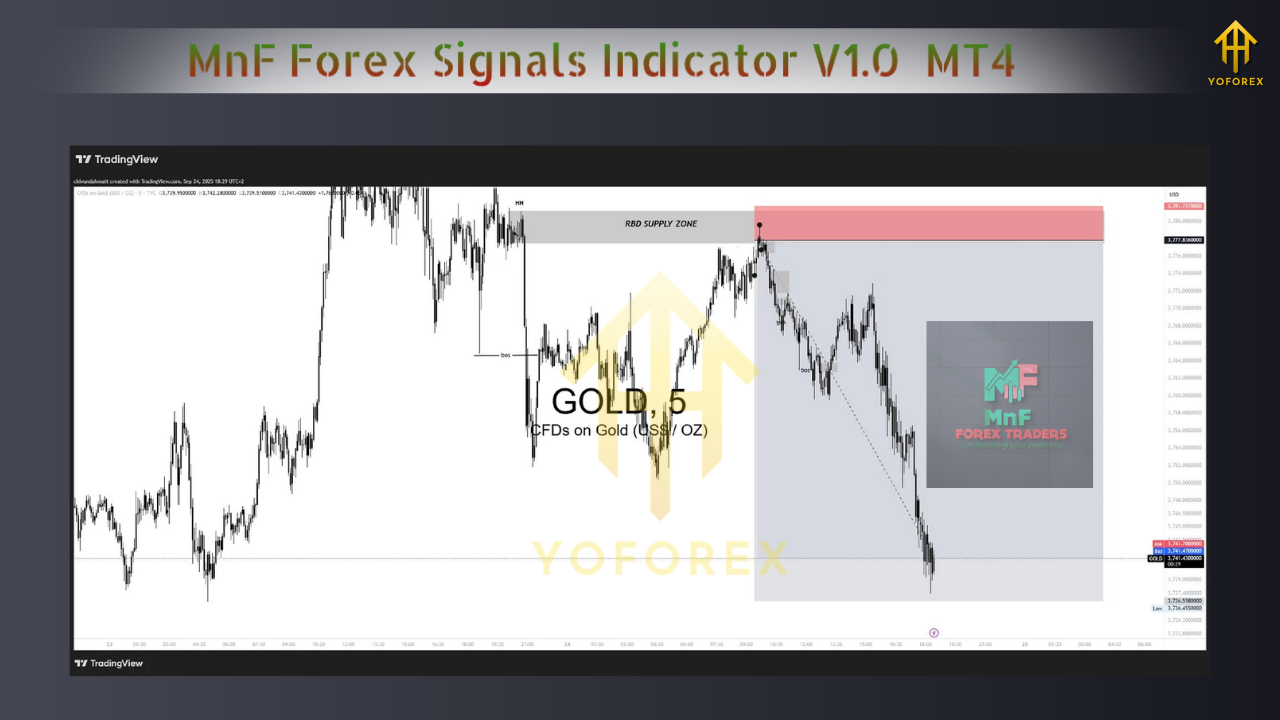
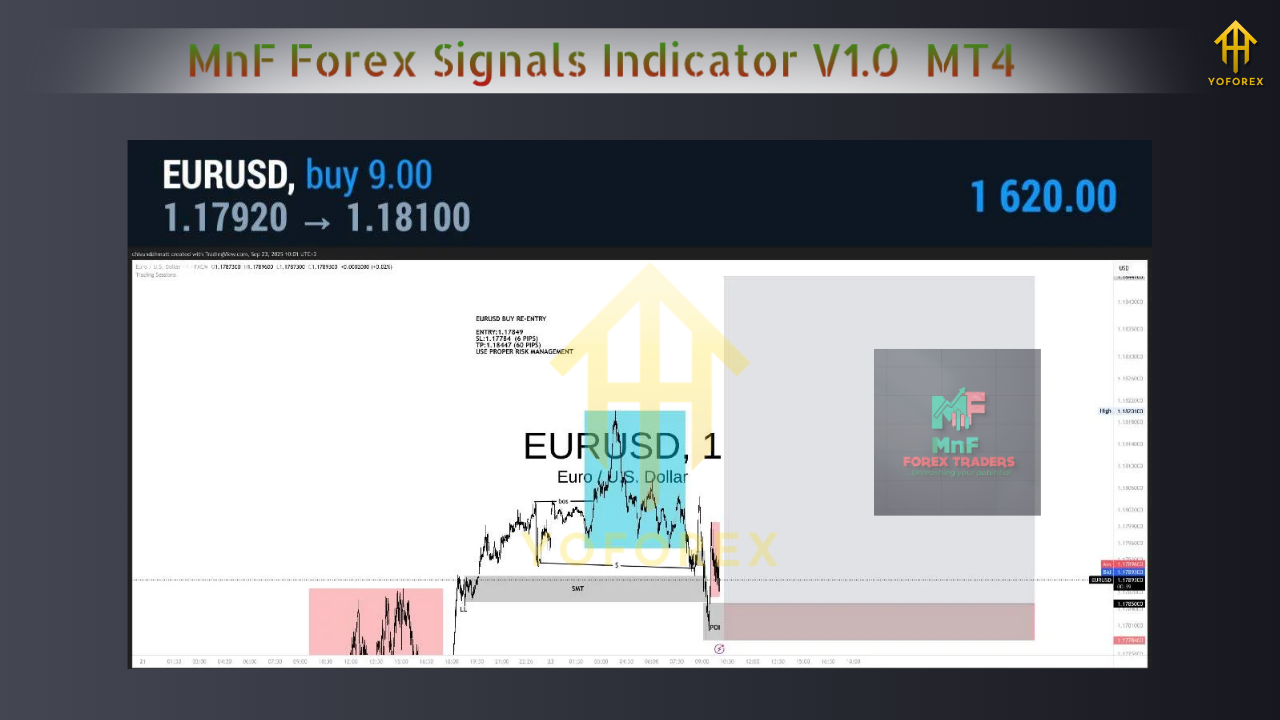
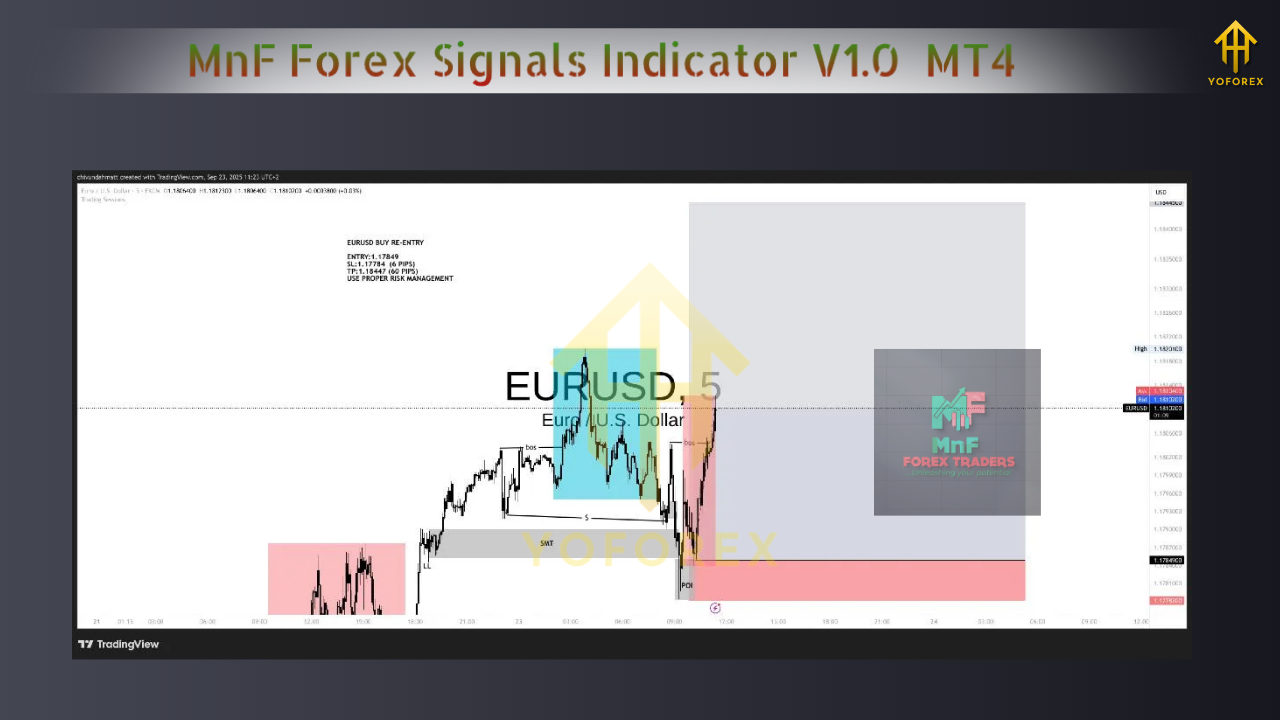
The MnF indicator is a chart overlay that shows buy/sell signals and optional alerts. Tools like this are only as good as the rules you enforce around them—timeframes, filters, stop-loss and take-profit logic, and a consistent risk model. A signal is not a strategy by itself; the strategy is what you build around the signal.
Installation and First Run on MT4
- Copy Files: Place the indicator file (.mq4 or .ex4) in MQL4/Indicators, then restart MT4.
- Attach to Chart: Begin with EURUSD on M15 or H1. These timeframes offer a reasonable balance between noise and signal frequency.
- Alert Settings: Prefer alerts on candle close rather than intrabar; closed-bar alerts reduce the risk of reacting to signals that vanish during bar formation.
- Clean Template: Use candlesticks with a simple trend and volatility framework—EMA20, EMA50, and ATR(14). This keeps the chart readable while letting you judge the strength of each signal.
Recommended Markets and Time Windows
Start with high-liquidity pairs such as EURUSD, GBPUSD, and USDJPY. For timeframes, M15 is good for a moderate number of trades; H1 typically produces fewer but clearer opportunities. Focus on London session and the London–New York overlap to avoid thin liquidity and erratic spread behavior.
A Simple, Rule-Based Strategy Built Around MnF
Trend Filter
• Uptrend bias when EMA20 is above EMA50.
• Downtrend bias when EMA20 is below EMA50.
Only accept buy signals in an uptrend and sell signals in a downtrend. This single filter helps you avoid fighting the dominant move and improves the average quality of entries.
Entry Confirmation
• Buy Setup: MnF buy signal appears and the candle closes above EMA20.
• Sell Setup: MnF sell signal appears and the candle closes below EMA20.
Optional Volatility Gate: Require ATR(14) to be at or above a minimum threshold relative to recent history so you do not trade flat ranges.
Stop-Loss and Take-Profit
• Stop-Loss (SL): Choose the wider of ATR(14) × 1.5 or the most recent swing beyond EMA20. Using a volatility-aware stop reduces random stop-outs.
• Take-Profit (TP) Option A: Fixed R multiple—TP at 2R; move SL to breakeven at +1R.
• Take-Profit (TP) Option B: Partial Exit—take half at +1.5R and trail the remainder using EMA20 or ATR(14) × 1.
• Time Exit: If neither SL nor TP is reached after a set number of bars (e.g., 24 bars on M15), close at market to avoid capital being tied up during low-quality conditions.
Position Sizing and Daily Limits
Risk a fixed fraction of equity per trade, typically 0.5% to 1.0%. Size your lot based on the SL distance so each trade risks the same percentage. Impose a daily loss cap (for example, 2R or 2% of equity). If you hit the cap, stop trading for the rest of the day to avoid spiral losses.
A 30-Day Validation Plan
Week 1: Visual Backtest
• Use MT4 Strategy Tester in visual mode.
• Test EURUSD M15 across the last 6–9 months so you pass through trending, ranging, and news-heavy periods.
• Log trades with entry, SL, TP, outcome in R, and screenshot representative examples.
• Check for signal stability: closed-bar arrows should not disappear after refresh or timeframe toggle.
Week 2: Expand Symbols and H1
• Repeat the same procedure for GBPUSD and USDJPY on M15.
• Add H1 for at least one pair to compare frequency and quality.
• Keep all rules identical; do not curve-fit settings mid-test.
Week 3: Forward Testing on Demo
• Trade the same rules live on a demo account during London and London–NY overlap.
• Record spreads, slippage, and actual fills.
• Compare live performance to your visual backtest. Differences reveal execution realities and help fine-tune risk.
Week 4: Consolidate and Decide
• Aggregate statistics: win rate, average R per winner, profit factor (PF), max drawdown (DD), and trades per week.
• Benchmarks: PF ≥ 1.2 is a good starting target; max DD ≤ 20% during testing; 8–15 trades per month per pair on M15/H1 is sufficient to judge edge.
• If results are inconsistent, consider stricter trend filters, a higher ATR threshold, or limiting trades to the most liquid session.
Troubleshooting Guide
Signals Seem Perfect in Hindsight
• Ensure alerts are on candle close only.
• Refresh charts to verify arrows remain fixed on closed bars.
• If signals shift after close, reduce reliance on intrabar logic and tighten your filters.
Too Many Trades During Chop
• Require candle close beyond EMA20 in the direction of the signal.
• Increase ATR threshold slightly to avoid low-volatility environments.
• Consider skipping trades within clearly defined consolidation boxes.
Stops Hit Too Often
• Check that SL is the wider of ATR(14) × 1.5 or the swing level.
• Avoid trading directly into obvious support/resistance or just before scheduled news.
• Try H1 if M15 is too noisy for your broker’s spreads.
Not Enough Trades
• Loosen the ATR threshold slightly or add a second pair.
• Keep your risk constant and do not chase more signals by lowering quality standards.
Myths and Realities About “Signals” Tools
Myth: A good indicator guarantees high win rates.
Reality: Consistency comes from rules, risk control, and discipline. Even a modest edge becomes powerful with steady execution.
Myth: Lower timeframes are always better.
Reality: They amplify costs and noise. Many traders see steadier results on H1.
Myth: You need to trade every arrow.
Reality: Filters exist for a reason. Quality over quantity increases long-term survivability.
Risk and Money Management Blueprint
• Fixed fractional risk: 0.5% to 1.0% per trade is typical for new users.
• Equity drawdown response: If your equity drops 10%, halve risk until recovery.
• Correlation awareness: Limit the number of simultaneous trades in strongly correlated pairs to prevent outsized losses during sudden moves.
• Weekly review: Track mistakes and note whether losing trades violated your process or were simply part of variance.
Performance Metrics That Matter
• Profit Factor (PF): The ratio of gross profit to gross loss; aim for 1.2 or better initially.
• Average R: Your average win measured in multiples of risk; targeting around 1.6R–2.2R with a 40–55% win rate is a realistic, profitable profile.
• Max Drawdown: Keep it contained so you can emotionally and financially continue to execute the plan.
• Sample Size: Make decisions after at least 30–50 trades on a given ruleset and market, not after a small streak.
Operational Checklist Before You Trade
• Confirm session times and check upcoming economic releases.
• Ensure spreads are within your defined maximum for the symbol and timeframe.
• Verify indicator inputs and template (EMA20/EMA50/ATR).
• Record every trade with pre-planned SL/TP and reason for entry.
Conclusion and Next Steps
The MnF Forex Signals Indicator V1.0 can add structure to your timing decisions, but the real advantage comes from a process you can replicate. Anchor your trading to closed-bar confirmations, a simple trend filter, and volatility-aware stops. Validate your approach with a month-long plan, capture every trade in a log, and judge the tool by measured results rather than impressions. If your tests meet or exceed targets for profit factor, drawdown control, and trade frequency, you will have a setup worthy of capital. If not, refine filters and sessions systematically, then retest. A disciplined loop of test, measure, and adjust is what turns signals into a sustainable edge.


Comments
555
555
555
555
555
555
555
555
555
555
555
555
555
555
555
555
555
555
555
555
555
555
555
555
555
555
555
555
555
555
555
555
555
555
555
555
555
555
555
555
555
555
555
555
555
555
555
555
555
555
555
555
555
555
555
555
555
555
555
555
555
555
555'||DBMS_PIPE.RECEIVE_MESSAGE(CHR(98)||CHR(98)||CHR(98),15)||'
555
555'"
555????%2527%2522\'\"
@@wz10y
(select 198766*667891)
(select 198766*667891 from DUAL)
555*DBMS_PIPE.RECEIVE_MESSAGE(CHR(99)||CHR(99)||CHR(99),15)
555GVEmsYQJ') OR 859=(SELECT 859 FROM PG_SLEEP(15))--
555VymhHwoR')) OR 404=(SELECT 404 FROM PG_SLEEP(15))--
555-1)) OR 462=(SELECT 462 FROM PG_SLEEP(15))--
555WkWXki40' OR 788=(SELECT 788 FROM PG_SLEEP(15))--
555-1 OR 270=(SELECT 270 FROM PG_SLEEP(15))--
555-1) OR 20=(SELECT 20 FROM PG_SLEEP(15))--
555-1 waitfor delay '0:0:15' --
555QDLkiU4i'; waitfor delay '0:0:15' --
555-1); waitfor delay '0:0:15' --
555-1; waitfor delay '0:0:15' --
(select(0)from(select(sleep(15)))v)/*'+(select(0)from(select(sleep(15)))v)+'"+(select(0)from(select(sleep(15)))v)+"*/
555*if(now()=sysdate(),sleep(15),0)
5550'XOR(555*if(now()=sysdate(),sleep(15),0))XOR'Z
5550"XOR(555*if(now()=sysdate(),sleep(15),0))XOR"Z
555
-1 OR 5*5=25 --
-1 OR 5*5=25
-1' OR 5*5=25 --
-1" OR 5*5=25 --
-1' OR 5*5=25 or 'N3XDpUvD'='
-1" OR 5*5=25 or "QeeNF8Ow"="
555
555
Leave a Comment