
Mastering Murrey Math Levels Indicator in MT5: A Comprehensive Guide for Traders
In the dynamic world of financial trading, having the right tools can make all the difference between success and failure. Among the numerous technical indicators available to traders, the Murrey Math Levels Indicator stands out for its unique approach to market analysis. This powerful tool, available for the MetaTrader 5 (MT5) platform, offers a systematic method for identifying potential support and resistance levels based on harmonic mathematical relationships.
For both novice and experienced traders, understanding how to effectively utilize the Murrey Math Levels Indicator can provide a significant edge in the markets. This comprehensive guide will walk you through everything you need to know about this indicator, from its origins and principles to practical applications and trading strategies.
What is Murrey Math?
- Murrey Math is a trading system developed by T.H. Murrey in the late 20th century, based on the observations of W.D. Gann and other market pioneers. Unlike many other technical analysis tools that rely solely on price action, Murrey Math incorporates elements of chaos theory, geometry, and harmonic mathematics to create a framework for understanding market behavior.
- The foundation of Murrey Math lies in the concept that financial markets exhibit natural patterns that can be quantified using specific mathematical relationships. These relationships are based on the idea that markets move in predictable cycles and that certain price levels act as natural support and resistance zones.
- What sets Murrey Math apart from other trading systems is its use of a unique set of levels that divide price action into eighths, creating a structured grid that traders can use to identify potential turning points, trend continuations, and breakout opportunities.
Understanding Murrey Math Levels Indicator
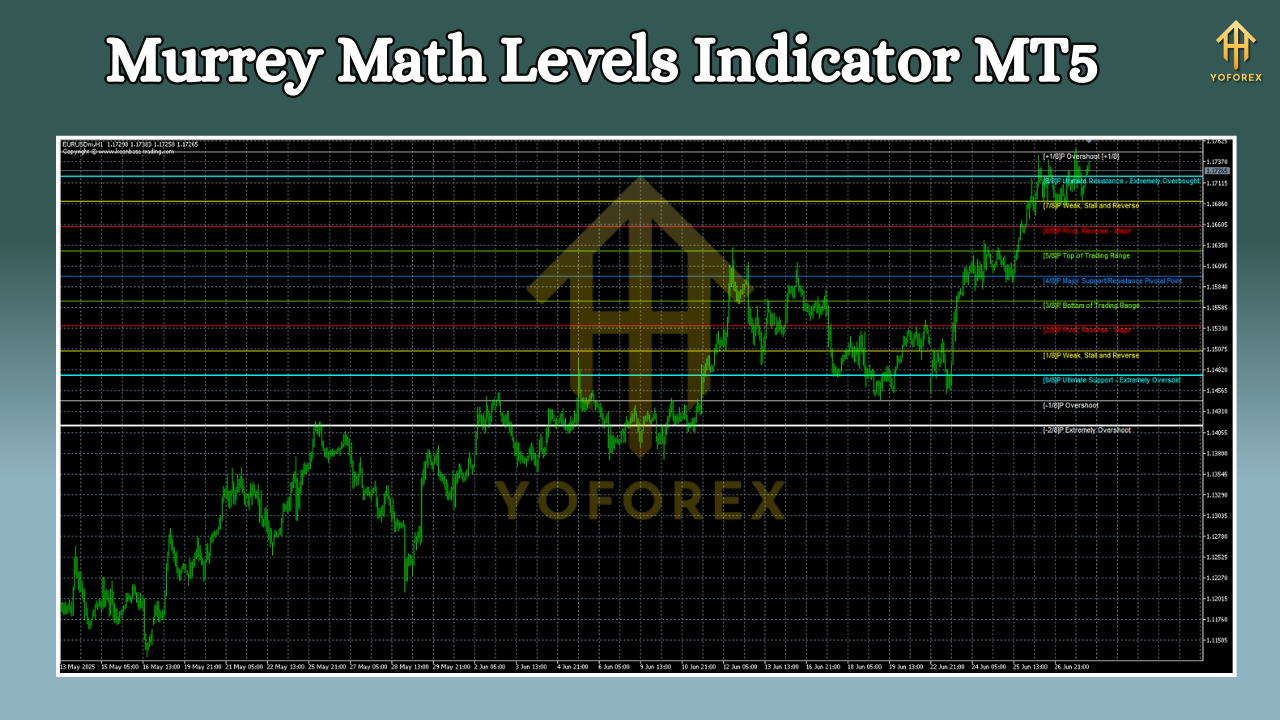
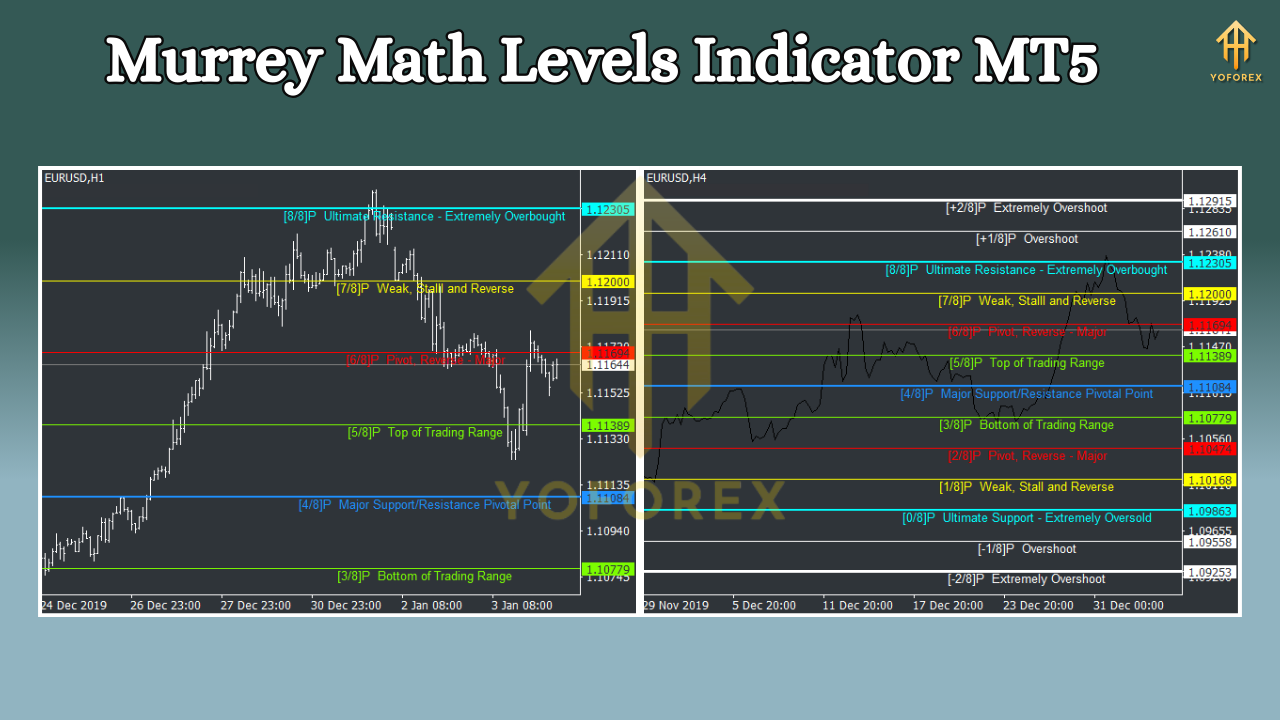
- The Murrey Math Levels Indicator is a technical analysis tool that displays a series of horizontal lines on a price chart, representing these key mathematical levels. These levels are calculated based on the most recent high and low prices over a specified period, creating a grid that adapts to market volatility.
- The indicator typically displays eight major levels, with each level further divided into eighths, creating a total of 64 potential price points. These levels are color-coded for easy identification, with the most significant levels often marked in different colors to indicate their strength.
- In MT5, the Murrey Math Levels Indicator can be applied to any timeframe, from one-minute charts to monthly charts, making it a versatile tool for various trading styles. The indicator automatically recalculates as new price data becomes available, ensuring that the levels remain relevant to current market conditions.
How to Install and Set Up Murrey Math Levels Indicator in MT5
Getting started with the Murrey Math Levels Indicator in MT5 is a straightforward process. Follow these steps to install and configure the indicator:
- Download the Murrey Math Levels Indicator file (typically an .ex5 file) from a trusted source.
- Open your MT5 platform and go to "File" > "Open Data Folder."
- Navigate to the "MQL5" folder > "Indicators" folder.
- Copy the downloaded indicator file into the "Indicators" folder.
- Restart your MT5 platform or refresh the indicator list by right-clicking in the "Navigator" window and selecting "Refresh."
- To apply the indicator to a chart, right-click on the chart and select "Indicators" > "Custom" > "Murrey Math Levels" or simply drag the indicator from the Navigator window to your chart.
Once installed, you'll be presented with several customization options:
- Bars to Calculate: The number of bars the indicator uses to determine the most recent high and low.
- Line Color: Customize the color of the indicator lines.
- Line Thickness: Adjust the thickness of the lines for better visibility.
- Display Style: Choose between line, dot, or other display options.
- Level Colors: Differentiate between major and minor levels by assigning different colors.
For most traders, the default settings provide a good starting point, but you may want to adjust these parameters based on your trading style and the timeframe you're analyzing. For example, day traders might use fewer bars for calculation to capture more recent price action, while swing traders might use more bars to identify longer-term levels.
Using Murrey Math Levels for Trading Analysis
The Murrey Math Levels Indicator can be used in various ways to analyze market conditions and identify trading opportunities. Here are some of the primary methods:
Identifying Support and Resistance
The most basic application of the Murrey Math Levels is to identify potential support and resistance areas. The levels that correspond to the 0/8, 1/8, 2/8, 6/8, and 7/8 points are considered the strongest support and resistance zones. When price approaches these levels, traders should pay close attention to potential reactions.
Trend Analysis
The position of price relative to the Murrey Math levels can provide valuable information about trend strength. When price consistently remains above the 4/8 level, it suggests a strong uptrend, while price consistently below the 4/8 level indicates a strong downtrend. The 4/8 level itself often acts as a major support or resistance level in trending markets.
Breakout Identification
The Murrey Math Levels can help traders identify potential breakout opportunities. When price approaches a significant level (such as 2/8, 6/8, or 8/8) and shows signs of breaking through, it may signal the beginning of a new trend or continuation of an existing one.
Reversal Detection
Conversely, when price reaches extreme levels (0/8 or 8/8) and shows signs of reversing, it may indicate a potential trend reversal. The indicator can help traders spot these reversals early, allowing for timely entry points.
Trading Strategies
Breakout Strategy
One popular approach is to trade breakouts of key Murrey Math levels. Here's how it works:
- Identify a market that has been trading in a range, with price bouncing between two Murrey Math levels.
- Wait for price to break above the upper level or below the lower level with increased volume.
- Enter a trade in the direction of the breakout.
- Place a stop loss just beyond the opposite side of the range.
- Consider taking profits at the next Murrey Math level or using a trailing stop.
Reversal Strategy
The reversal strategy focuses on trading price action at extreme levels:
- Monitor price as it approaches the 0/8 or 8/8 levels.
- Look for reversal candlestick patterns or other indicators to confirm a potential reversal.
- Enter a trade in the opposite direction of the previous trend.
- Place a stop loss beyond the extreme level.
- Set profit targets at intermediate Murrey Math levels.
Trend Following Strategy
For traders who prefer to follow trends, the Murrey Math Levels can be used to identify entry points within established trends:
- Determine the overall trend direction (above or below the 4/8 level).
- Wait for price to pull back to a Murrey Math level that acts as support in an uptrend or resistance in a downtrend.
- Enter a trade in the direction of the main trend.
- Place a stop loss beyond the level you're trading from.
- Set profit targets at subsequent Murrey Math levels.
Risk Management Considerations
Regardless of the strategy you choose, proper risk management is crucial. Here are some general guidelines:
- Never risk more than 1-2% of your trading capital on a single trade.
- Adjust position sizes based on the distance between your entry and stop loss.
- Consider using a risk-reward ratio of at least 1:2 for potential profits to be at least twice your risk.
- Be prepared for the possibility that trades may not work out as expected.
Benefits
Clear and Objective Levels
One of the primary advantages of the Murrey Math Levels Indicator is that it provides clear, objective levels for making trading decisions. Unlike subjective support and resistance areas that traders might draw manually, Murrey Math levels are calculated based on a mathematical formula, removing emotional bias from the equation.
Versatility Across Timeframes
The indicator works effectively across all timeframes, from one-minute charts to monthly charts. This versatility makes it suitable for various trading styles, including scalping, day trading, swing trading, and position trading.
Applicability to Different Markets
Murrey Math Levels can be applied to various financial markets, including forex, stocks, commodities, and indices. This universality makes it a valuable tool for traders who diversify across different asset classes.
Psychological Aspects
The Murrey Math levels often coincide with psychological price levels that traders watch, such as round numbers. This alignment can create self-fulfilling prophecies as multiple traders react to the same levels, potentially amplifying their effectiveness.
Limitations and Considerations
Potential Drawbacks
While the Murrey Math Levels Indicator is a powerful tool, it's not without limitations. Like all technical indicators, it's not infallible and can produce false signals, especially in choppy or sideways markets. Traders should be aware of these limitations and avoid relying solely on the indicator for their trading decisions.
When Not to Use the Indicator
The Murrey Math Levels Indicator may be less effective in highly volatile markets or during major economic announcements when price action becomes erratic. In such conditions, traders might consider using the indicator in conjunction with other tools or temporarily avoiding trading altogether.
Combining with Other Indicators
To enhance the effectiveness of the Murrey Math Levels Indicator, consider combining it with other technical analysis tools, such as moving averages, oscillators, or volume indicators. This multi-faceted approach can provide more robust trading signals and help filter out false positives.
Case Studies and Examples
Example 1: Breakout Strategy
Let's consider a hypothetical example using the EUR/USD currency pair on a 4-hour chart. Price has been trading between the 3/8 and 5/8 Murrey Math levels for several sessions, indicating a consolidation phase. Suddenly, price breaks above the 5/8 level with increased volume. A trader using the breakout strategy might enter a long position at the break, with a stop loss placed just below the 3/8 level. The profit target could be set at the 6/8 or 7/8 level.
Example 2: Reversal Strategy
In another scenario, Bitcoin price on a daily chart approaches the 8/8 Murrey Math level after a strong uptrend. The candlestick formation shows a doji pattern, suggesting indecision and a potential reversal. A trader using the reversal strategy might enter a short position, with a stop loss placed above the 8/8 level. The profit target could be set at the 7/8 or 6/8 level.
These examples illustrate how the Murrey Math Levels Indicator can be applied in real trading scenarios. However, it's important to remember that past performance doesn't guarantee future results, and traders should always test any strategy thoroughly before implementing it with real capital.
Conclusion
The Murrey Math Levels Indicator is a powerful technical analysis tool that can provide valuable insights into market structure and potential trading opportunities. Its mathematical approach to identifying support and resistance levels offers traders an objective framework for making trading decisions.
By understanding the principles behind Murrey Math and learning how to effectively apply the indicator in various market conditions, traders can enhance their technical analysis skills and improve their overall trading performance. Whether you're a day trader looking for precise entry points or a swing trader seeking to identify major trend reversals, the Murrey Math Levels Indicator can be a valuable addition to your trading toolkit.
As with any trading tool, the key to success lies in proper education, practice, and risk management. We encourage traders to thoroughly test the Murrey Math Levels Indicator on demo accounts before implementing it with real money, and to always consider it as part of a comprehensive trading plan rather than a standalone solution.
By combining the Murrey Math Levels Indicator with sound trading principles and other technical analysis tools, traders can develop a robust approach to navigating the financial markets with greater confidence and precision.
Support & Disclaimer
Got questions or need help? Reach out anytime:
- WhatsApp: https://wa.me/+443300272265
- Telegram: https://t.me/yoforexrobot
Disclaimer: Past performance is no guarantee of future results. All trading carries risk. Always demo-test the KT Murrey Math Levels Indicator MT5 in a risk-free environment before deploying on a live account.


Comments
No comments yet. Be the first to comment!
Leave a Comment